Speed Up With Microsoft
People use R for lots of reasons: “It’s great for the models I need”, “I like the functional approach”, “It’s the tool I’m most comfortable with”.
People don’t use R for these reasons: “I have a favourite processor core, I don’t want to use the others”, “I love how my memory needs to fit all my data”.
What if I told you that you didn’t need to worry about that any more?
Multi-threaded R
Microsoft have their own version of R called Microsoft R
Client.
It has a bunch of high-tech, whiz-bang features, but we’re going to
focus on one: multi-threading calculations. Vanilla R is single
threaded.This means any calculations are done sequentially, in order,
one at a time. However, this isn’t using the ability of most modern,
domestic laptops. To get setup with Microsoft R Client, follow the
install
instructions.
Once you’ve got Microsoft R Client installed, you will need to make sure
it’s the version of R that is active in your session. If you are using
RStudio this is easy to do by going to
Tools > Global Options > General > R Version.
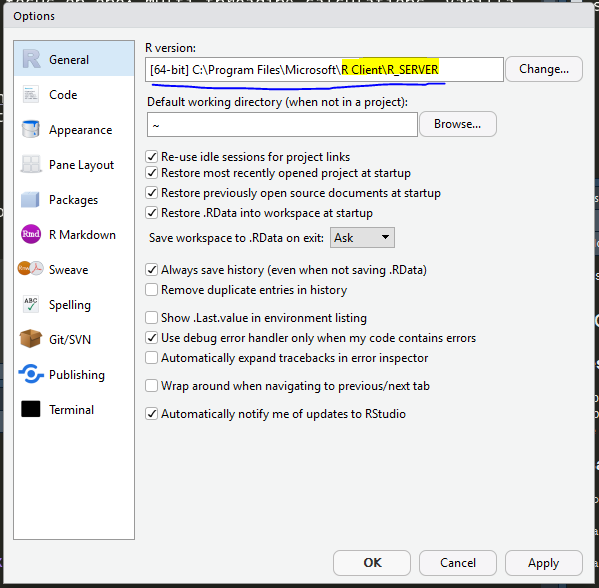
You will probably be asked to Restart R Studio, so close it and open back up, then we can run the code.
R version 3.4.3 (2017-11-30) -- "Kite-Eating Tree"
Copyright (C) 2017 The R Foundation for Statistical Computing
Platform: x86_64-w64-mingw32/x64 (64-bit)

R is free software and comes with ABSOLUTELY NO WARRANTY.
You are welcome to redistribute it under certain conditions.
Type 'license()' or 'licence()' for distribution details.

R is a collaborative project with many contributors.
Type 'contributors()' for more information and
'citation()' on how to cite R or R packages in publications.

Type 'demo()' for some demos, 'help()' for on-line help, or
'help.start()' for an HTML browser interface to help.
Type 'q()' to quit R.

Microsoft R Open 3.4.3
The enhanced R distribution from Microsoft
Microsoft packages Copyright (C) 2018 Microsoft

Loading Microsoft R Client packages, version 3.4.3.0097.
Microsoft R Client limits some functions to available memory.
See: https://go.microsoft.com/fwlink/?linkid=799476 for information
about additional features.

Type 'readme()' for release notes, privacy() for privacy policy, or
'RevoLicense()' for licensing information.

Using the Intel MKL for parallel mathematical computing(using 2 cores).
Default CRAN mirror snapshot taken on 2018-01-01.
See: https://mran.microsoft.com/.
This message will pop up, and it’s worth noting as it’s got some information in it that you might need to think about:
- It’s worth noting that right now Microsoft r Client is lagging
behind the current
Rversion, and is based on version 3.4 ofR, not 3.5. This will mean your default package libraries will not be shared between the installations if you are runningR3.5. - It’s using a snapshot of
CRANcalledMRANto source packages by default. 90% of the time it will operate just as you expect, but because it takes a ‘snapshot’ of packages, newer features and changes that have hitCRANmay not be in the version of the package you are grabbing.RevoScaleRand probably theggplot2anddplyrpackages will likely be installed for you already as default in Microsoft R Client. The other two you will probably have to install yourself.
- Intel MKL will have scanned your system on install and attempted to work out how many cores your processor has. Here it’s identified 2 on my old Lenovo Yoga. This is where the speed boost will come from.
knitr::opts_chunk$set(echo = TRUE)
library(microbenchmark)
library(RevoScaleR)
library(ggplot2)
library(lockeutils)
theme_set(theme_ld() + theme(axis.title.x = element_text(vjust = -1)))
library(dplyr)
Test Data
Here we make a set of example data, 3 data frame of random numbers with various ‘normal’ distributions. The data frames are of different lengths: 500,000 , 1,000,000 and 5,000,000.
set.seed(9000)
sample_df = function(n){
  data.frame(
    col_1 = c(rnorm(n, mean = 11, sd = 0.5)),
    col_2 = c(rnorm(n, mean = 6, sd = 1)),
    col_3 = c(rnorm(n, mean = 3, sd = 0.75))
  )
}

df_500k <- sample_df(500000)
df_1m <- sample_df(1000000)
df_5m <- sample_df(5000000)
Benchmarking
Running benchmarks in R is easy with the microbenchmark package. The
package tries to be as accurate as possible in measuring the time for
each of it’s runs, and also allows you to easily compare different
approaches and specify the amount of repeats. I’ve decided to test each
of the 3 data sets in each of 2 different linear modelling functions,
giving 6 different groups of results. Each group will be run 10 times
for a total set of 60 runs.
res <- microbenchmark(
  lm_50k = lm(col_1 ~ col_2 + col_3, data = df_500k),
  rxLM_50k = rxLinMod(col_1 ~ col_2 + col_3, data = df_500k, reportProgress = 0),
  lm_1m = lm(col_1 ~ col_2 + col_3, data = df_1m),
  rxLM_1m = rxLinMod(col_1 ~ col_2 + col_3, data = df_1m, reportProgress = 0),
  lm_5m = lm(col_1 ~ col_2 + col_3, data = df_5m),
  rxLM_5m = rxLinMod(col_1 ~ col_2 + col_3, data = df_5m, reportProgress = 0),
  times = 10
  )
Results
The res object is of class microbenchmark, and has a plotting method
that can be used via ggplot2::autoplot().
autoplot(res) +
  labs(title = "Violin plot of model run durations",
       subtitle = "`rxLinMod()` vs `lm()`",
       caption = "Microsoft R Client 3.4.3, 2 cores")
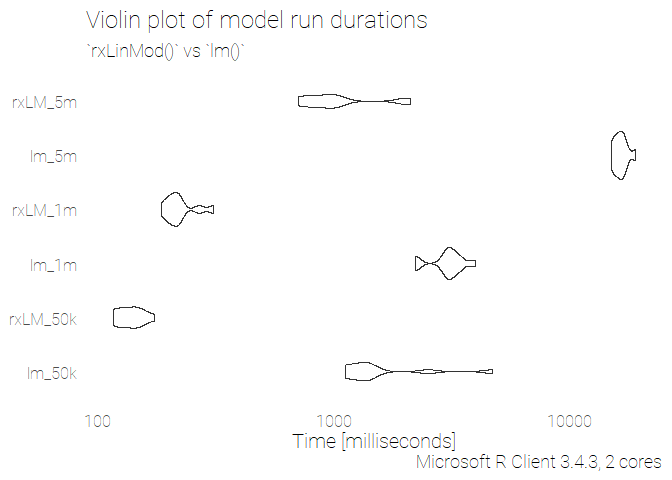
In each of these tests, we can see that the RevoScaleR::rxLinMod()
functions outperforms the base lm() by a large margin. Note the log
scale for Time [milliseconds]!
knitr::kable(summary(res))
| expr | min | lq | mean | median | uq | max | neval |
|---|---|---|---|---|---|---|---|
| lm_50k | 1106.2070 | 1141.3168 | 1740.0966 | 1340.5601 | 1474.8239 | 4679.1277 | 10 |
| rxLM_50k | 115.3501 | 120.7544 | 137.2811 | 136.9788 | 147.7357 | 171.9592 | 10 |
| lm_1m | 2203.7005 | 2890.8738 | 3018.6052 | 3072.3086 | 3340.6342 | 3934.8914 | 10 |
| rxLM_1m | 184.8220 | 199.1018 | 223.0184 | 214.2320 | 223.2292 | 307.1239 | 10 |
| lm_5m | 14897.7473 | 15450.7170 | 16295.3558 | 16183.4236 | 16720.8177 | 18837.9140 | 10 |
| rxLM_5m | 704.0234 | 805.8069 | 1108.2574 | 965.9696 | 1044.1400 | 2084.2737 | 10 |
But how?
It does this because the Microsoft R Client uses Intel MKL for
parallel mathematical computing. This allows the RevoScaleR package
to implement a ‘parallelised algorithm’ to solve the linear regression
using the BLAS and LAPACK FORTRAN libraries. More technical details are
avilable in the
docs.
What about the out of memory part?
RevoScaleR and Microsoft R Client can help with that, though the
solution requires a little more involvement. The short version is that
it can leverage distributed data sources as a backend, such as spark,
hadoop and sqlserver. this allows the data to be spread across many
compute nodes that are managed by software called ‘Microsoft Machine
Learning Server`. This is a good overview of the
ideas
on the main site, which also holds all the documentation.
Would you like to know more?
Locke Data have are developing course going into depth with this
technology from an R context and are releasing it at the end of
October. Please come and join us
(virtually!) for some hands-on learning and detailed tutorials.