R for developers
Steph Locke
2018-07-19
Upfront stuff
Agenda
- Why you should know R
- What are the ways you can write R
- How you can help R users improve their code
- How R users can consume your code
- How you can get R code into production
Me
- Data Scientist
- Microsoft AI MVP
- Microsoft Machine Learning MCT
- Author: geni.us/rfundamentals
- Locke Data
- t: @theStephLocke
Locke Data
- Data Science Consultancy
- Focussed on helping orgs start
- Site: itsalocke.com
- t: @lockedata
This talk
- Get the slides at itsalocke.com/talks
- Grab a sticker and/or a business card
- Book giveaway for good questions
- Limited supply of tshirts available
Why you should know R
Why
- Data Science
- Data wrangling
- Cross-platform capability
- Reproducibility
- Efficeincy
- Flexibility
- Cash
Why not Python?
It isn’t one or the other
There’s plenty of ways for these two languages to interoperate and co-exist. Pick the right hammer for a given nail!
Data profiling
DataExplorer::create_report(iris)Nice webscraping
library(tidyverse)
library(rvest)

"https://en.wikipedia.org/wiki/List_of_superhero_debuts" %>%
  read_html() %>%
  html_nodes(xpath = "//*[@id='mw-content-text']/div/table") %>%
  map(html_table, fill = TRUE) %>%
  map_df( ~ mutate(., `Year Debuted` = as.character(`Year Debuted`))) %>%
  mutate(`Char_Team` = coalesce(`Character / Team / Series`, `Character / Team`)) %>%
  select(Char_Team, Year_Debut = `Year Debuted`) %>%
  mutate(Year = str_extract(Year_Debut, "[0-9]{4}")) %>%
  skimr::skim()
## Skim summary statistics
## n obs: 376
## n variables: 3
##
## -- Variable type:character -----------------------------------------------------
## variable missing complete n min max empty n_unique
## Char_Team 0 376 376 0 92 1 376
## Year 1 375 376 4 4 0 92
## Year_Debut 1 375 376 4 38 0 248Great dataviz
library(leaflet)
data(quakes)

# Show first 20 rows from the `quakes` dataset
leaflet(data = quakes[1:20, ]) %>% addTiles() %>% addMarkers(~long, ~lat, popup = ~as.character(mag),
    label = ~as.character(mag))
Super apps
Data driven content
- R
- Python
- JS
- Bash
- SQL
Ways you can write R
Variables, comments, etc
# Define a variable
a <- 25

# Call a variable
a
## [1] 25# Do something to it
a + 1## [1] 26Structures
# Vector
a = c(25, 30)

# Matrix
matrix(a)
## [,1]
## [1,] 25
## [2,] 30# Data frame
data.frame(a, b = a/5, c = LETTERS[1:2])## a b c
## 1 25 5 A
## 2 30 6 B# List
list(vector = a, matrix = matrix(a))## $vector
## [1] 25 30
##
## $matrix
##      [,1]
## [1,]   25
## [2,] 30Functions
# Define a function
showAsPercent <- function(x) {
    paste0(round(x * 100, 0), "%")
}

# Call a function
showAsPercent(0.1)
## [1] "10%"Extending R
# Get a package
install.packages("tibble")

# Activate a package
library(tibble)

# Use the package as a namespace
tibble::as.tibble(a)
Base (similar to pandas)
df <- data.frame(a = 1:10, b = LETTERS[1:5])  # setup
df[1:2, ]  # row numbers
## a b
## 1 1 A
## 2 2 Bdf[df$a < 2, ] # value filters## a b
## 1 1 ABase (similar to pandas)
df[df$a < 3, 1] # column filter## [1] 1 2df[df$a < 3, 1, drop = FALSE] # column filter (keep data.frame)## a
## 1 1
## 2 2OO
# Orig OO (s3): cyclismo.org/tutorial/R/s3Classes.html
library(R6)
Loan <- R6Class("Loan", public = list(term = NA, initialize = function(term) {
    if (!missing(term)) {
        self$term <- term
    }
}, extendBy = function(ext) {
    self$term <- self$term + ext
}))
OO
acc <- Loan$new(36)
acc$extendBy(6)
acc$term
## [1] 42Functional
library(magrittr)
iris %>% {
    tail(., nrow(.)/5)
} %>% pairs()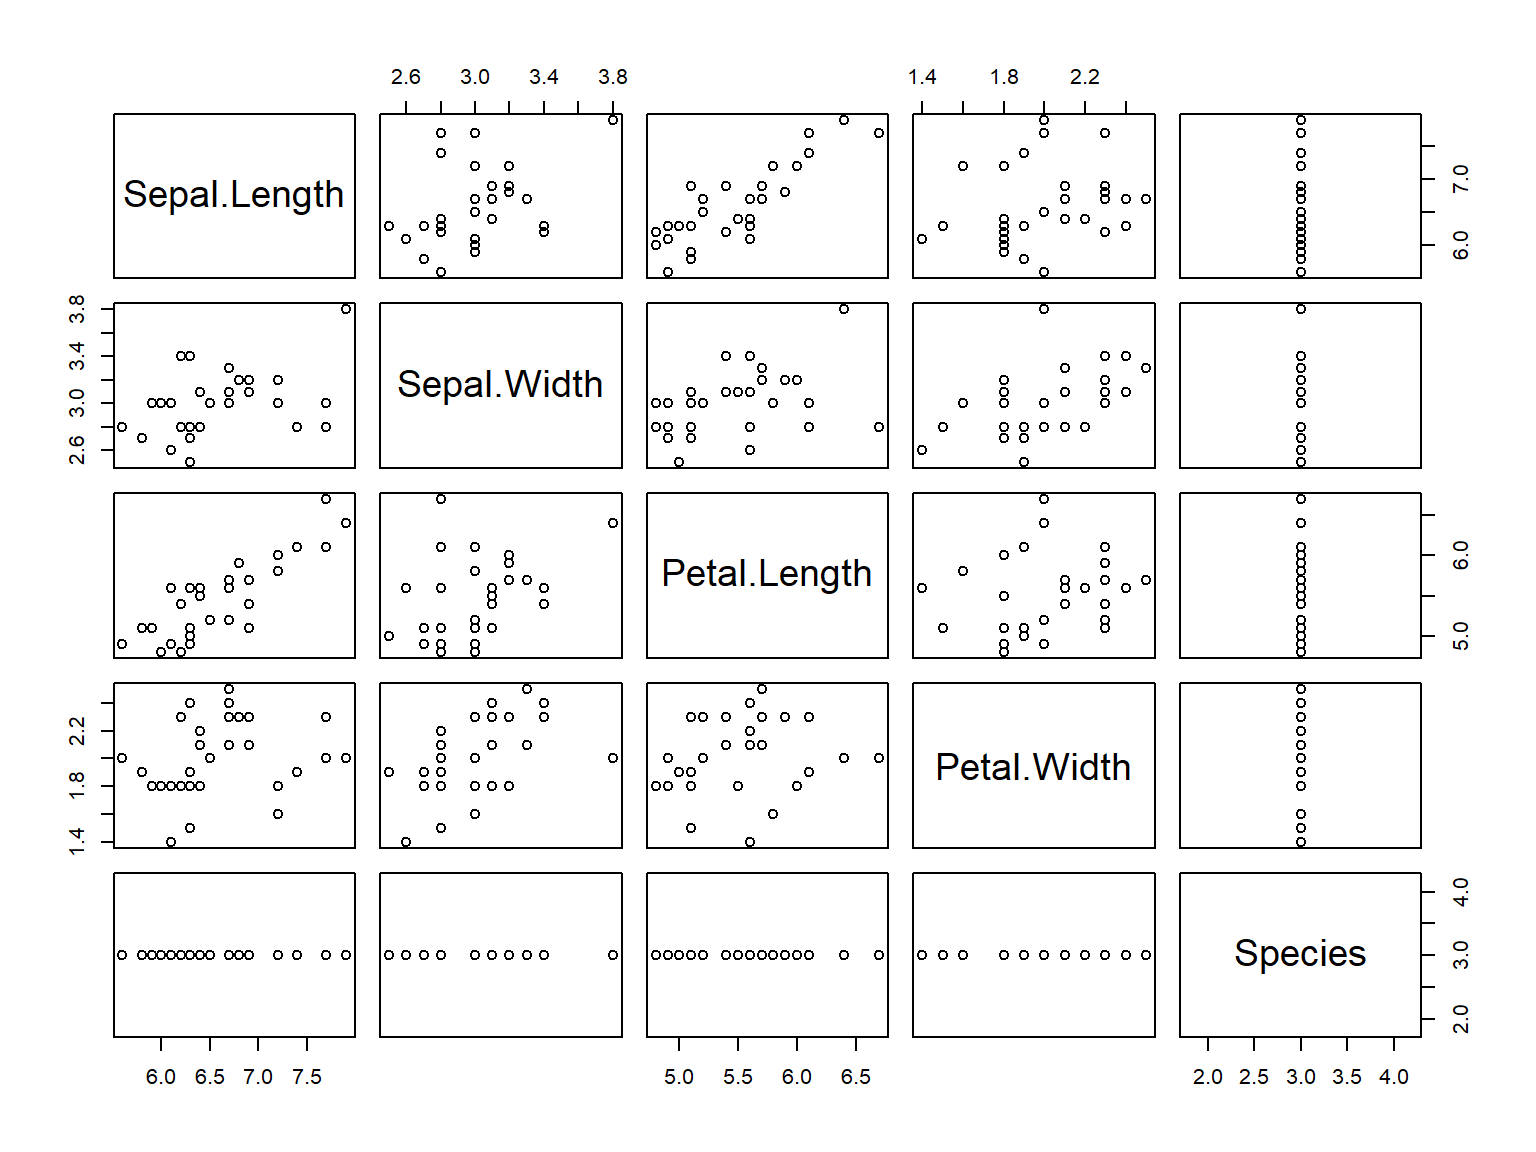
Functional
library(tidyverse)
iris %>% filter(Petal.Width < 2) %>% group_by(Species) %>% summarise_all(mean)
## # A tibble: 3 x 5
## Species Sepal.Length Sepal.Width Petal.Length Petal.Width
## <fct> <dbl> <dbl> <dbl> <dbl>
## 1 setosa 5.01 3.43 1.46 0.246
## 2 versicolor 5.94 2.77 4.26 1.33
## 3 virginica 6.34 2.79 5.32 1.76Best practices
- Make sure to declare packages using
library()at the top of the script - Label sections of work using
# ---- SectionName ----to allow you to pick up the code into a LaTeX or markdown doc later - Never delete <- always make new objects with modifications
- If comfortable with coding, or have a lot of data to process use
data.tableoverdplyr - Try to do all data manipulation at the top of the script
- Reuse your code by writing functions for anything you do frequently
Documentation
Document as you go!
- Use markdown to use a light syntax for integrating your code and commentary
- Use LaTeX for finer level of control on output layout
- Use these instead of Excel or Word so that a change in assumption means updating the code and re-running the doc
- Load your main R file up and use the labels from
# ---- SectionName ----to save repetition - Present in HTML, slide decks, PDF, Word at the click of a button
Workflow best practices
- Focus on working code & documentation
- Use source control (github)
- Write tests (
assertive,assertthat,testthat) - Regularly visualise (
ggplot2) - Do code reviews
- Modularise
- Use Rstudio
- Consider structuring as a package
Next steps
- geni.us/rfundamentals
- notebooks.azure.com/stephlocke/libraries
rstats
- datacamp.com
- r-bloggers.com
How you can help R users improve their code
Building packages
github.com/lockedata/pRojects geni.us/rpkgs
devtools::install_github("lockedata/projects")
pRojects::createPackageProject()
Writing tests
- testthat
- stubthat
- mockr
library(testthat)
context("Some thing I want to test")
test_that("things make sense", expect_equal(1, 1))
Code coverage
library(covr)
`?`(package_coverage)
`?`(codecov)
Continuous integration
- Travis CI
How R users can consume your code
JavaScript
library(V8)
ct <- v8()
ct$eval("var foo = 123")
ct$eval("var bar = 456")
ct$eval("foo + bar")
## [1] "579"ct$source(system.file("js/underscore.js", package = "V8"))
ct$call("_.filter", mtcars, JS("function(x){return x.mpg < 15}"))## mpg cyl disp hp drat wt qsec vs am gear carb
## Duster 360 14.3 8 360 245 3.21 3.570 15.84 0 0 3 4
## Cadillac Fleetwood 10.4 8 472 205 2.93 5.250 17.98 0 0 3 4
## Lincoln Continental 10.4 8 460 215 3.00 5.424 17.82 0 0 3 4
## Chrysler Imperial 14.7 8 440 230 3.23 5.345 17.42 0 0 3 4
## Camaro Z28 13.3 8 350 245 3.73 3.840 15.41 0 0 3 4Python
library(reticulate)
main <- import_main()
builtins <- import_builtins()
builtins$print("foo")
py_run_string("x = 10")
# access the python main module via the 'py' object
py$x
## [1] 10APIs
library(httr)
"https://foaas.com/version" %>% GET() %>% content()
## $message
## [1] "Version 2.0.0"
##
## $subtitle
## [1] "FOAAS"How you can get R code into production
plumber
rplumber.io
#' Echo the parameter that was sent in
#' @param msg The message to echo back.
#' @get /echo
function(msg = "") {
    list(msg = paste0("The message is: '", msg, "'"))
}
opencpu
- opencpu.org
- jsfiddle.net/user/opencpu/fiddles/
docker
- containerit
- rize
- liftr
Hadoop(ish)
- sparklyr
- ML Server
- Jupyter
Microsoft
- SQL Server sp_execute_external_script()
- ML server
- Azure ML Studio
- Power BI
Shiny
- shinyserver
- shinyapps.io
- shinyproxy.io
Thank you!
Covered
- Why you should know R
- What are the ways you can write R
- How you can help R users improve their code
- How R users can consume your code
- How you can get R code into production
Follow up
- itsalocke.com/talks
- geni.us/rfundamentals
- t: @theStephLocke
- t: @LockeData