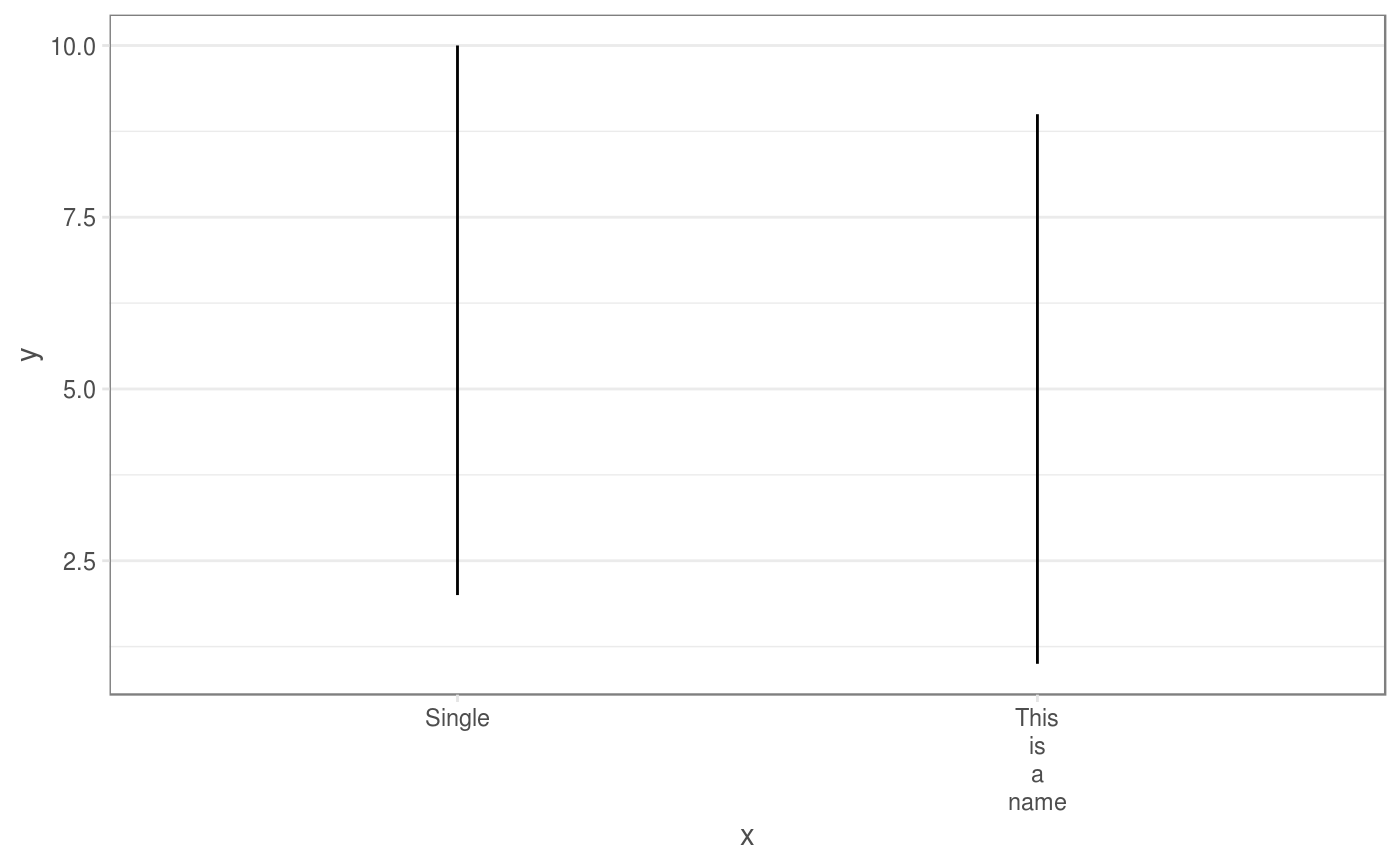
Designed for splitting strings to fit better on axis on charts
wordwrap(x, ...)
Arguments
| x | string |
|---|---|
| ... | Allows additional parameters to be passed to gsub |
See also
Other helper: CJ.dt,
convertToXML, generatePDF,
pounds_format, sanitise,
thousands_format
Examples
library('ggplot2')
names <- wordwrap(c("This is a name","Single"))
ggplot(data.frame(x=names,y=1:10),aes(x,y))+theme_optimum()+geom_line()
