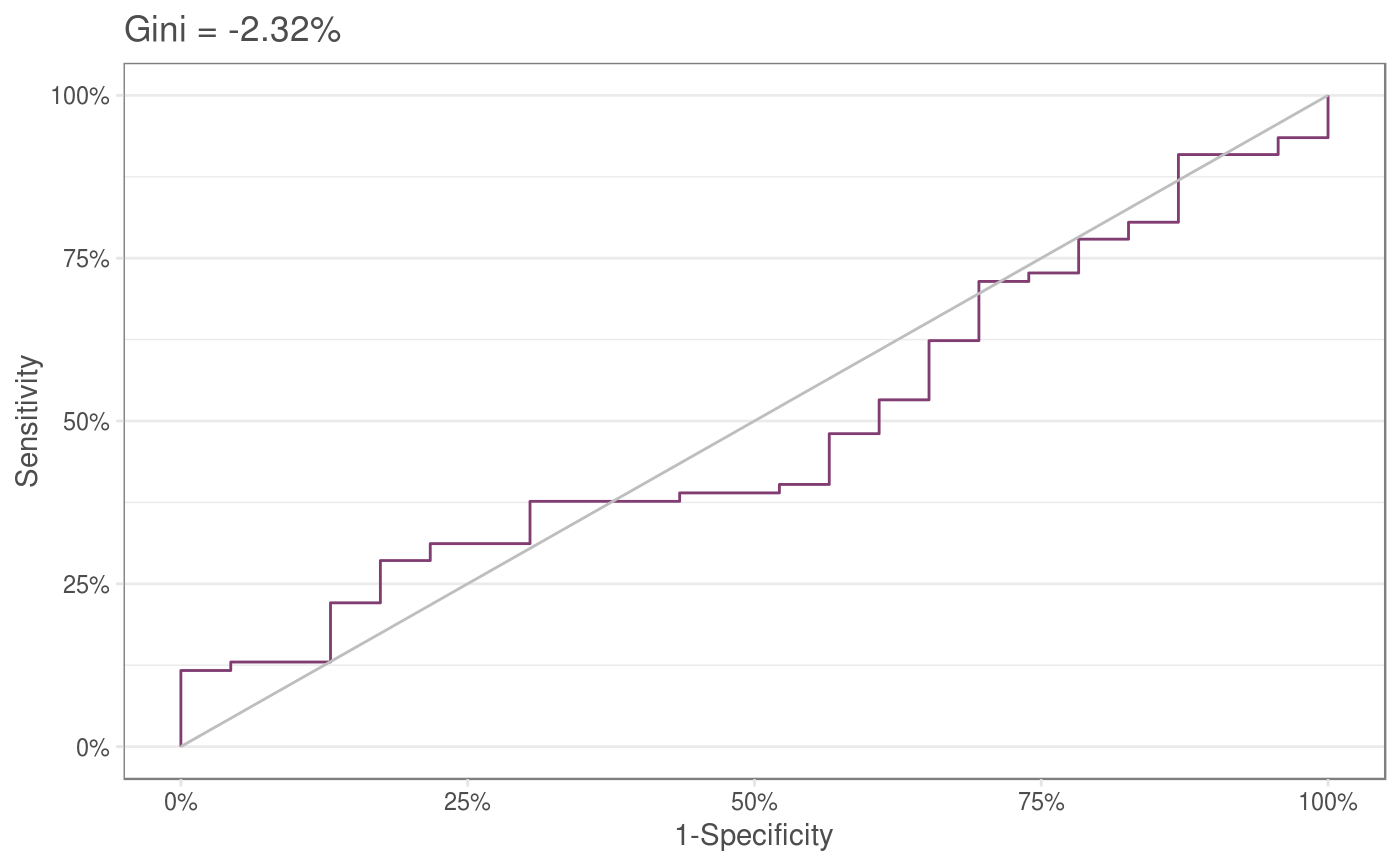
This function uses ggplot to produce a themed Receiver Operator Curve and calculates a Gini coefficient based on it.
giniChart(pred, act)
Arguments
| pred | Logit/scores/probabilities to be compared against actuals |
|---|---|
| act | This should be a column containing outcomes in a boolean form either as a factor or number |
See also
AUC roc giniCoef
Other creditrisk: giniCoef,
logit.odd, logit.prob,
odd.logit, odd.prob,
prob.logit, prob.odd,
scaledScore
Examples
  sampledata<- data.frame(val= rnorm(100) , outcome=rbinom(100,1,.8))
  giniChart(sampledata$val,sampledata$outcome)