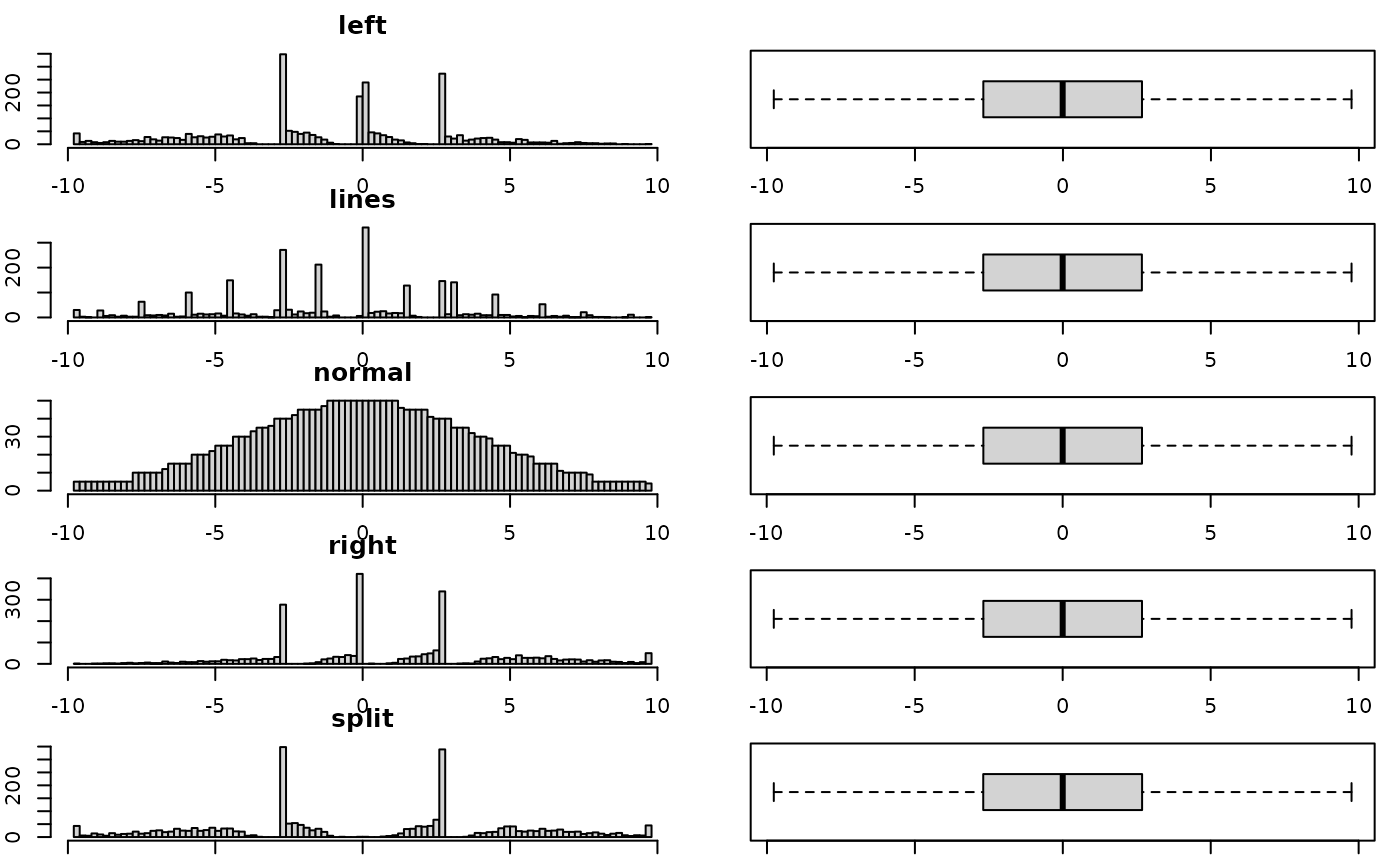
This dataset is the box plot data produced by Matjeka & Fitzmaurice to demonstrate applicability of their process.
Format
A data frame with 2484 rows and 5 variables:
left: data pulled to the left
lines: data with arbitrary spikes along a range
normal: normally distributed data
right: data pulled to the right
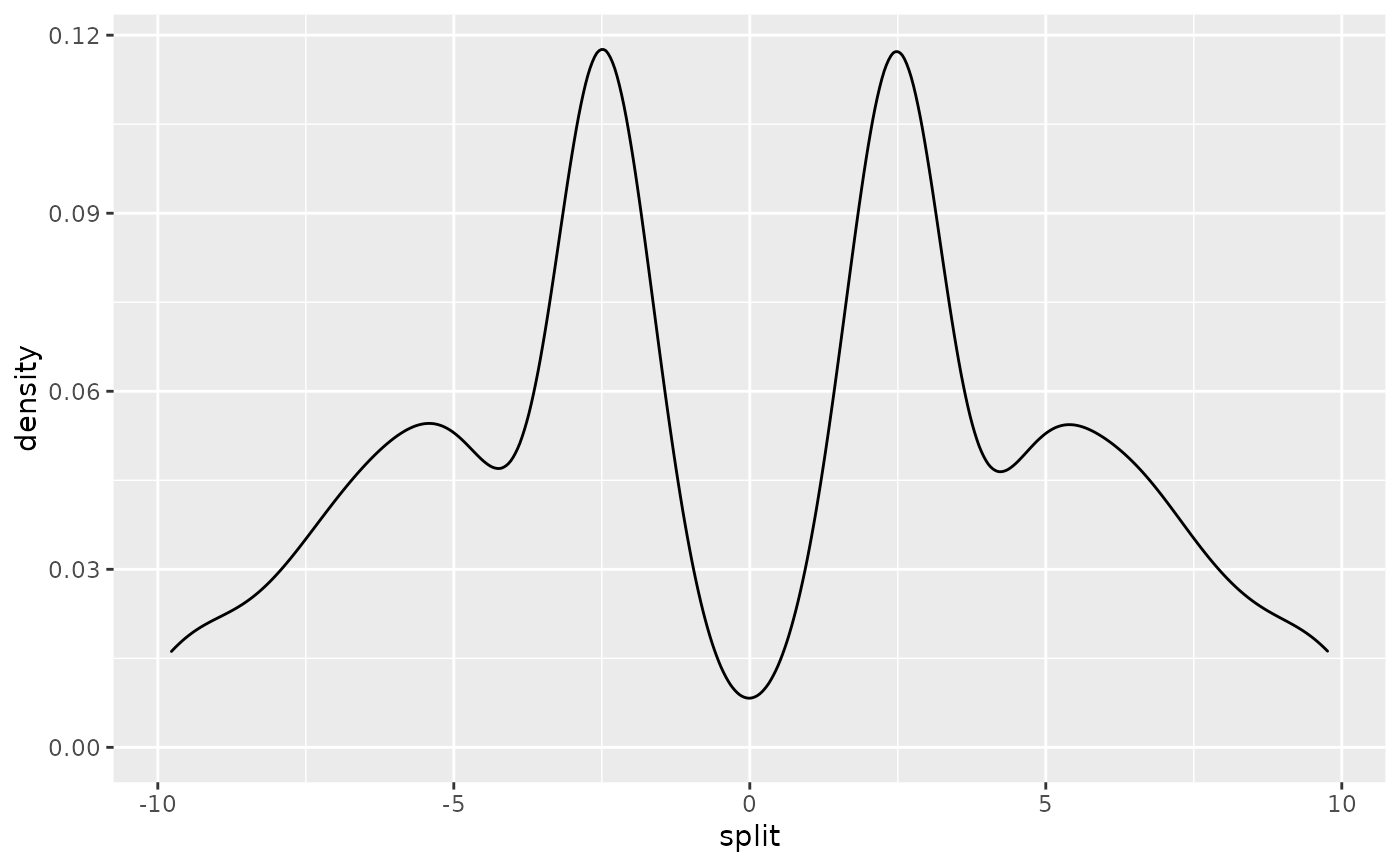
split: split data
References
Matejka, J., & Fitzmaurice, G. (2017). Same Stats, Different Graphs: Generating Datasets with Varied Appearance and Identical Statistics through Simulated Annealing. CHI 2017 Conference proceedings: ACM SIGCHI Conference on Human Factors in Computing Systems. Retrieved from https://www.autodeskresearch.com/publications/samestats.
Examples
summary(box_plots)
#>       left              lines               normal          right
#>  Min.   :-9.76964   Min.   :-9.769575   Min.   :-9.76   Min.   :-9.760
#>  1st Qu.:-2.68999   1st Qu.:-2.689993   1st Qu.:-2.68   1st Qu.:-2.680
#>  Median :-0.00999   Median :-0.007132   Median : 0.00   Median : 0.000
#>  Mean   :-1.17780   Mean   :-0.831733   Mean   : 0.00   Mean   : 1.174
#>  3rd Qu.: 2.67007   3rd Qu.: 2.670236   3rd Qu.: 2.68   3rd Qu.: 2.680
#>  Max.   : 9.75025   Max.   : 9.756001   Max.   : 9.76   Max.   : 9.760
#>      split
#>  Min.   :-9.769886
#>  1st Qu.:-2.689989
#>  Median :-0.003099
#>  Mean   :-0.003060
#>  3rd Qu.: 2.680000
#>  Max.   : 9.760000

## base plot

#save current settings
state <- par("mar", "mfrow")

par(mfrow = c(5, 2), mar=c(1,2,2,1))

nms <- names(box_plots)

for (i in 1:5){
  nm <- nms[i]
  hist(box_plots[[nms[i]]],
       breaks = 100,
       main = nm)
  boxplot(box_plots[[nms[i]]],
          horizontal = TRUE)
}


#reset settings
par(state)

## ggplot
if(require(ggplot2)){
  ggplot(box_plots, aes(x=left))+
    geom_density()
  ggplot(box_plots, aes(x=lines))+
    geom_density()
  ggplot(box_plots, aes(x=normal))+
    geom_density()
  ggplot(box_plots, aes(x=right))+
    geom_density()
  ggplot(box_plots, aes(x=split))+
    geom_density()
}
#> Loading required package: ggplot2
#reset settings
par(state)
## ggplot
if(require(ggplot2)){
ggplot(box_plots, aes(x=left))+
geom_density()
ggplot(box_plots, aes(x=lines))+
geom_density()
ggplot(box_plots, aes(x=normal))+
geom_density()
ggplot(box_plots, aes(x=right))+
geom_density()
ggplot(box_plots, aes(x=split))+
geom_density()
}
#> Loading required package: ggplot2